Investment options vary widely, but understanding the key factors and timing is crucial for success. Learning to invest using the yield curve chart helps identify signals that predict recessions or economic growth.
Olav Dirkmaat, Dutch economics professor and co-director of UFM Market Trends, predicts a recession within 6 to 9 months based on historical data. He also warns of a potential decline in the US stock market.
Dirkmaat’s conclusion stems from analyzing the yield curve, a vital economic indicator known for forecasting US recessions. Given today’s interconnected markets, such a downturn would have global impacts.
Read More: Pivot Points: Definition and Their Purpose Explained
And what is the yield curve chart?
The yield curve chart visually represents the relationship between bond yields and their maturity dates. Governments issue bonds to borrow money, offering returns to investors, and the chart reflects the impact of fiscal and monetary policies.
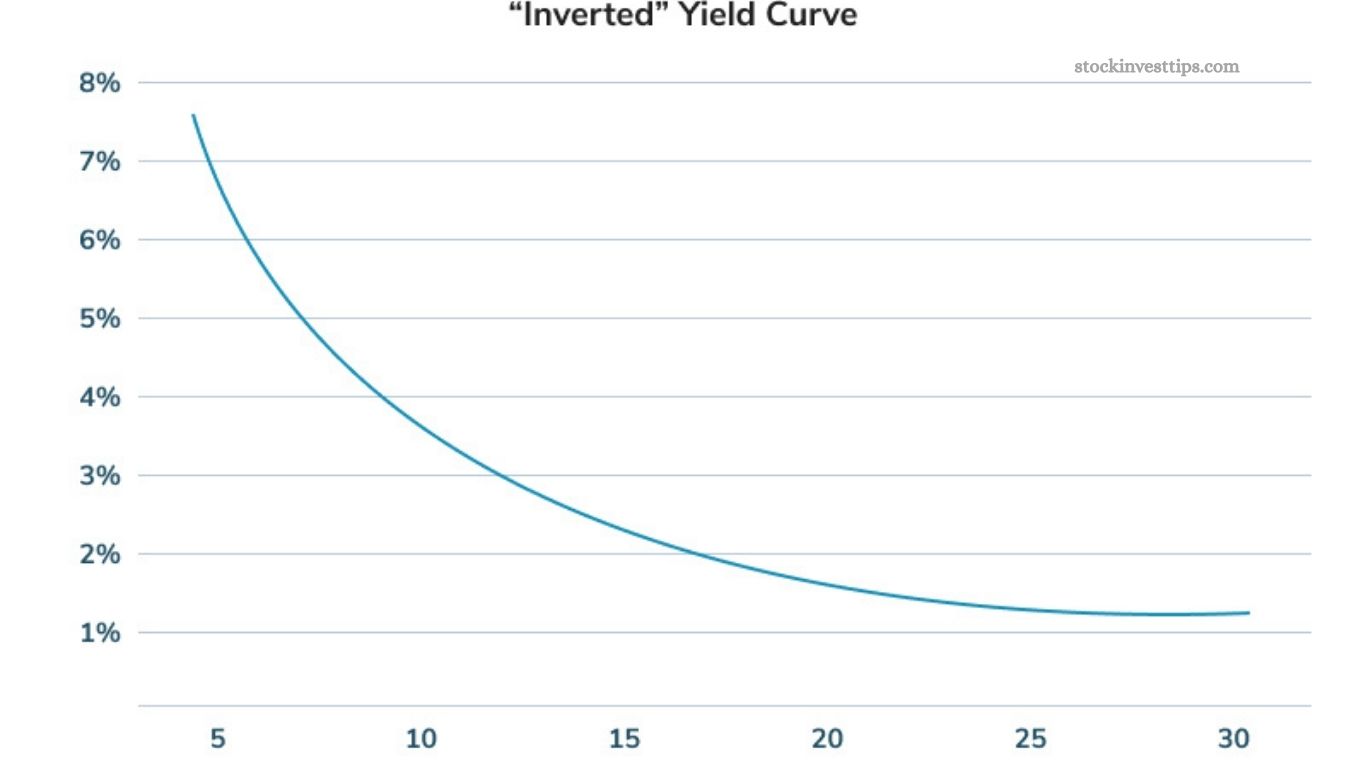
Historically, recessions often follow when the yield curve inverts—short-term yields exceed long-term yields—making it a key predictor of economic downturns. This pattern holds true even when reviewing data since World War II.
Typically, after a recession, the curve steepens as the Federal Reserve lowers interest rates to stimulate growth. Conversely, when inflation rises, the Fed increases short-term rates, causing the curve to flatten or invert, signaling potential economic trouble.
The yield curve can behave in three ways:
- Upward slope: Longer-term bonds yield more, reflecting higher risk and expectations of economic growth.
- Descending slope: Lower future yields predict slower economic activity.
- Bonds above or below the curve: Bonds priced above the curve offer better returns for their term, while those below offer less.
In essence, the yield curve tracks the difference between short-term and long-term government bond interest rates. A normal curve indicates a healthy economy with higher long-term rates, while an inverted curve often signals a looming recession.
Olav Dirkmaat highlights the yield curve as the most reliable crisis indicator, emphasizing its critical role in forecasting economic shifts.
The key “messages” of the performance curve
After flattening throughout much of 2017, the US Treasury yield curve has recently started to steepen again. Historically, investors view the yield curve’s shape as a key indicator of future economic growth. By mid-2018, the curve signaled ongoing expansion.
The yield curve chart remains a valuable tool for tracking the economic cycle in real time. Its effectiveness improves when factoring in changing interest rates, helping investors identify sectors likely to outperform the market.
For less experienced investors, seeking expert guidance is essential to leverage this tool effectively and achieve better investment outcomes.
Frequently Asked Questions
What is the yield curve chart?
The yield curve chart displays the relationship between bond yields and their maturities, showing how interest rates vary over different time frames.
How does the yield curve affect investment decisions?
Investors use the yield curve to gauge economic trends. A normal upward curve suggests growth, while an inverted curve often signals a potential recession, influencing where and when to invest.
What does investing based on the yield curve mean?
It means using the yield curve’s signals to choose bonds or other financial instruments with maturities that align with expected economic conditions, aiming for optimal returns and risk management.
Why is the yield curve considered a recession predictor?
Historically, when short-term interest rates exceed long-term rates (yield curve inversion), it has preceded recessions, making it a reliable economic warning sign.
Can investing on the yield curve improve portfolio performance?
Yes, by analyzing the yield curve, investors can identify opportunities in specific sectors or maturities that are likely to outperform during different economic cycles.
Should beginners invest based on the yield curve?
While useful, interpreting the yield curve requires expertise. Beginners should consult financial experts before making investment decisions based on the yield curve.
Conclusion
Investing based on the yield curve chart offers valuable insights into future economic trends and interest rate movements. As a powerful indicator, the yield curve helps investors anticipate recessions, inflation, or growth periods—guiding smarter decisions in both bond markets and broader investment strategies.
While it’s a complex tool, understanding its patterns or consulting experts can help investors identify opportunities, manage risks, and improve overall portfolio performance. Whether you’re a seasoned investor or just starting out, leveraging the yield curve can be a strategic advantage in navigating today’s dynamic financial landscape.

