Today, we’ll explore Pivot Points: what they are, how to calculate them using the Traditional Method, and their purpose. While this discussion focuses on the Traditional approach, other popular methods exist, including Fibonacci, Woodie, and Camarilla, each with unique calculation techniques.
Pivot Points help identify potential support and resistance levels where prices may reverse. Keep in mind, these tools are optional aids—not guarantees of profit or investment advice. Like any tool, Pivot Points have both supporters and critics, so it’s up to you to decide whether to use them.
What are Pivot Points?
Pivot Points are essential tools in trading, especially for scalping, as they highlight key support and resistance levels where significant price movements often occur. Calculated as a mathematical average of an asset’s previous day data, the pivot point marks the shift in market sentiment from bearish to bullish or vice versa. Traders use them as guidance within technical analysis, while financial institutions consider them indicators of market strength.
These points help traders decide when to hold positions until prices reach support or resistance levels, and they serve as crucial entry and exit signals. When the price breaks above the pivot point, it indicates a bullish trend; breaking below signals a bearish trend. Investors rely on Pivot Points to time their market entries and exits based on these trends.
Read More: Analyzing Share Purchases in the Stock Market: A Step-by-Step Guide
Representation of the Pivot Points
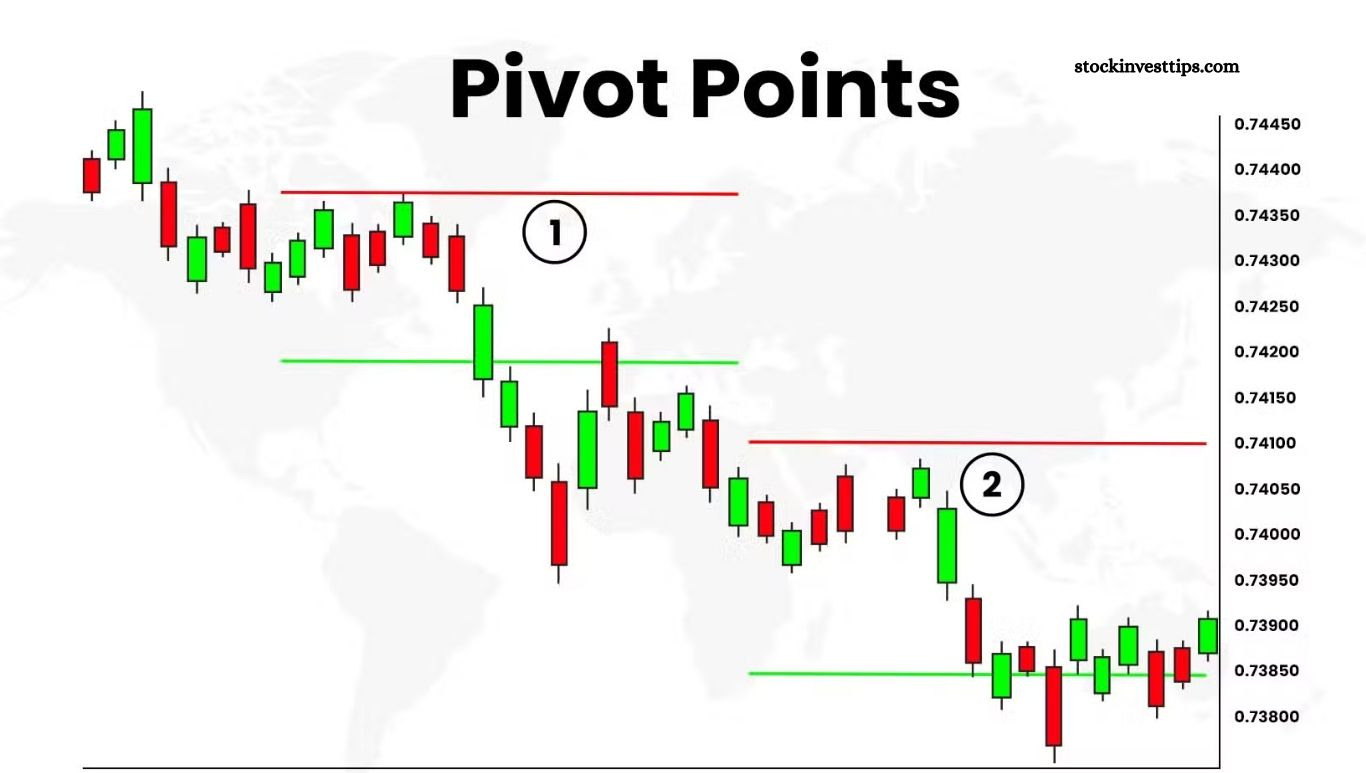
Pivot Points appear as horizontal lines on price charts, serving as key reference levels for making informed trading decisions. While some traders dismiss them as clutter, relying only on the previous day’s high and low to mark basic support and resistance, pivot points offer more value. They represent the price level where market sentiment shifts from bearish to bullish—or vice versa.
For example, the Ibex 35 closing on Friday, 28/12/2018, can illustrate this concept. Many traders use pivot points as trend indicators, finding them helpful for guiding trades. In essence, pivot points set clear price targets and help avoid premature exits. To maximize effectiveness, however, they should be combined with other technical tools.
How are they calculated?
This method calculates five key points using three data values from the previous day: closing price (C), highest price (H), and lowest price (L).
The formulas are:
- Pivot Point (P) = (C + H + L) / 3
- First Resistance (R1) = L – (2 × P)
- First Support (S1) = H – (2 × P)
- Second Resistance (R2) = (R1 – S1) + P
- Second Support (S2) = (R1 – S1) – P
After calculating these points—using tools like the Stock Exchange Success calculator—you apply them to your preferred chart, typically on short-term timeframes like 5, 15, or 30 minutes for scalping. Simply enter the previous day’s closing, high, and low prices into the calculator to get the pivot and support/resistance levels.
The trend is bullish if the price breaks above the pivot point and bearish if it breaks below. Because scalping involves very short-term trades, update pivot points daily to stay accurate.
How are they represented?
On the chart, pivot points are displayed as follows:
- The base Pivot Point is shown with a solid black horizontal line.
- First and second resistance levels (R1, R2) appear as red dotted lines.
- First and second support levels (S1, S2) are marked with green dotted lines.
For example, consider the IBEX 35 closing on Friday, 28/12/2018.
Trading is straightforward: if the price opens above the base pivot, enter a long position and close it near R1 or R2. If it opens below, enter a short position targeting S1 or S2. You can also go long when the price nears S2, and short when it approaches R2, capitalizing on potential reversals.
Frequently Asked Questions
What are Pivot Points?
Pivot Points are technical analysis indicators that mark potential support and resistance levels based on the previous trading day’s price data. They help traders identify market trends and possible reversal points.
How are Pivot Points calculated?
Using the Traditional Method, Pivot Points are calculated by averaging the previous day’s high, low, and closing prices. From this base, support and resistance levels are derived with specific formulas.
What is the purpose of Pivot Points?
Pivot Points help traders determine entry and exit points, set price targets, and gauge market sentiment shifts between bullish and bearish trends.
Which timeframes are best for using Pivot Points?
Pivot Points are widely used in short-term trading strategies like scalping, often applied to 5, 15, or 30-minute charts, but can also guide longer-term trading.
Are Pivot Points reliable?
While Pivot Points are valuable tools, they should be combined with other indicators to confirm signals, as no single tool guarantees success.
Can Pivot Points be used in all markets?
Yes, Pivot Points apply across various markets including stocks, forex, commodities, and indices.
Conclusion
Pivot Points offer a practical, mathematically grounded way to identify key support and resistance levels in trading. By highlighting potential market turning points, they assist traders in making informed decisions about entries, exits, and trend direction.
While especially useful for short-term strategies like scalping, their effectiveness increases when combined with other technical tools. Ultimately, Pivot Points are a valuable addition to any trader’s toolkit—but like all tools, they require careful use and should not be relied on in isolation.

