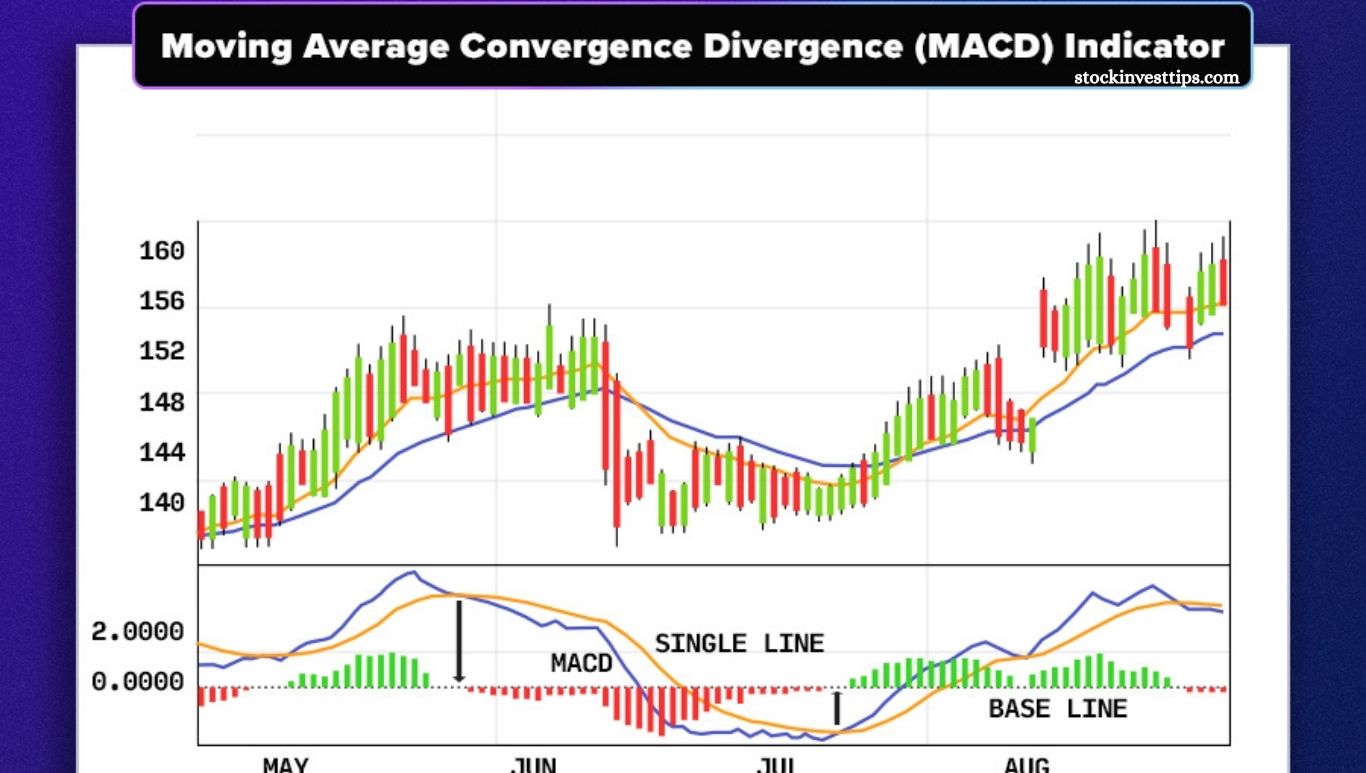
The MACD indicator (Moving Average Convergence Divergence) is one of the most essential and widely used tools in both stock and Forex trading. Created by Gerald Apple, its primary role is to track price trends through an oscillator format. Another equally respected tool is the RSI indicator, which I recommend learning after mastering the MACD with this tutorial. After this introduction, we will review an image of the MACD indicator for practical use.
How is the MACD calculated?
The indicator features two lines and a series of bars. The blue line, called the MACD, is derived by subtracting the 26-period exponential moving average from the 12-period exponential moving average. The orange line, known as the signal line, is a 9-period exponential moving average that helps identify buy or sell signals when it crosses the MACD line or the zero line. The purple bars, called MACDh, represent the difference between the MACD and signal lines as a histogram.
Read More: How to Invest in Cryptocurrencies
How can I use the MACD?
Now that we understand the theory, how do we apply the MACD indicator in daily trading? There are two main ways to use it:
MACD and Signal Line Crossovers
This simple and effective strategy involves watching for the MACD line (blue) to cross the Signal line (orange). When the MACD crosses above the Signal, it signals a bullish position. When it crosses below, it signals a bearish position or an exit from the trade.
Using the current EUR/USD chart, green arrows mark entry points, red arrows mark exits, red boxes show time spent in the market, and yellow lines represent potential gains. This approach is reliable, especially in clear trends like the bullish EUR/USD, because the MACD excels as a trend-following tool. It’s perfect for swing traders looking to capitalize on both upward and downward moves.
When both lines cross the zero line
Another way to use the MACD indicator is by watching when the MACD line crosses above zero to enter bullish positions or below zero to go bearish. Applying this method to the same chart, we see two false signals but one strong, profitable entry where the position is maintained.
This approach tends to generate fewer trading signals and can produce many false entries during sideways markets, making it less appealing for some traders.
There’s also a third method—analyzing divergences between price and the MACD—but this technique deserves its own dedicated tutorial for a clear explanation.
How to configure the MACD?
Setting up the MACD indicator is simple. You only need to choose the speed for the three moving averages. Lower values make the averages faster, generating more signals but also more false ones. Higher values produce fewer signals but may delay entries.
The standard settings are 26 (long), 12 (short), and 9 (signal). For active swing trading with more trades, try the faster settings of 13, 5, and 10.
Many modern indicators include the MACD. For example, check out my Estrangeal Wizard indicator, which incorporates it.
How to add and configure MACD in Tradingview?
If you use TradingView, add the MACD indicator to all your charts by clicking on “Indicators” and searching for MACD. To adjust the moving average settings, simply click the gear icon next to the indicator.
How to add and configure MACD in PROREALTIME?
Adding the MACD indicator is easy—just click the “Add Indicator” button and search for MACD. Once found, click “Add” to insert it into your chart.
To customize the settings, click the gear (spanner) icon and adjust the moving average parameters as needed.
That wraps up the MACD guide. I hope it helps you make the most of this powerful tool.
Frequently Asked Questions
What does the MACD indicator show?
The MACD displays the relationship between two moving averages of price, helping identify trend direction and momentum.
How do I interpret MACD line and Signal line crossovers?
A bullish signal occurs when the MACD line crosses above the Signal line, suggesting a buy. A bearish signal happens when it crosses below, indicating a sell or exit.
What are the default MACD settings?
The standard settings are 12-period and 26-period exponential moving averages for the MACD line, and a 9-period EMA for the Signal line.
Can I change the MACD settings?
Yes, adjusting the periods changes the indicator’s sensitivity. Lower values produce faster signals but more false alerts, while higher values smooth the signals but delay entries.
How does the MACD histogram work?
The histogram shows the difference between the MACD and Signal lines, indicating the strength of momentum.
How can I use MACD for trading?
Common methods include watching for MACD and Signal line crossovers or when the MACD crosses the zero line to identify bullish or bearish trends.
Is the MACD effective in all market conditions?
MACD performs best in trending markets but can give false signals during sideways or choppy markets.
How do I add and configure MACD on TradingView?
Click “Indicators,” search for MACD, click “Add,” then customize settings by clicking the gear icon next to the indicator.
Conclusion
The MACD indicator remains a powerful and versatile tool for traders seeking to identify trends and momentum in the market. Its ease of use, combined with customizable settings, makes it suitable for both beginners and experienced traders.
Whether you prefer signal line crossovers or zero-line strategies, mastering the MACD can enhance your trading decisions and help you capture profitable opportunities. Incorporate it into your charts regularly, adjust settings to fit your style, and complement it with other indicators for the best results.

